Gnuplotをインストールする!(Ubuntu Desktop 22.04)

Ubuntu Desktop 22.04に、Gnuplotをインストールします。Gnuplotを使用して、グラフの作成を行うことができます。
Gnuplotをインストールする!
Gnuplotを標準のリポジトリからインストールします。
$ sudo apt install gnuplot
Reading package lists... Done
Building dependency tree... Done
Reading state information... Done
The following additional packages will be installed:
  aglfn gnuplot-data gnuplot-qt liblua5.4-0 libwxbase3.0-0v5 libwxgtk3.0-gtk3-0v5
Suggested packages:
  gnuplot-doc
The following NEW packages will be installed:
  aglfn gnuplot gnuplot-data gnuplot-qt liblua5.4-0 libwxbase3.0-0v5 libwxgtk3.0-gtk3-0v5
0 upgraded, 7 newly installed, 0 to remove and 25 not upgraded.
Need to get 6,667 kB of archives.
After this operation, 22.9 MB of additional disk space will be used.
...
グラフを描画する!
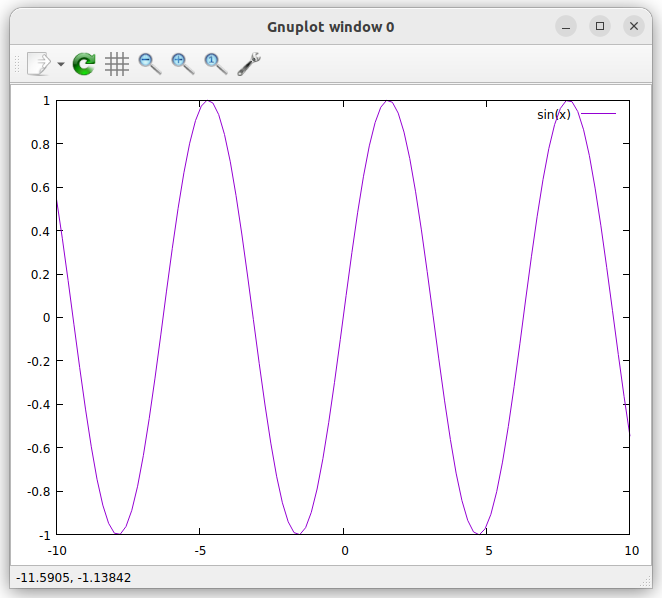
Gnuplotを起動して、Sin関数を描画してみます。
$ gnuplot

	G N U P L O T
	Version 5.4 patchlevel 2    last modified 2021-06-01

	Copyright (C) 1986-1993, 1998, 2004, 2007-2021
	Thomas Williams, Colin Kelley and many others

	gnuplot home:     http://www.gnuplot.info
	faq, bugs, etc:   type "help FAQ"
	immediate help:   type "help"  (plot window: hit 'h')

Terminal type is now 'qt'
gnuplot> plot sin(x)
以下のグラフが表示されいます。
おわりに
Ubuntu Desktop 22.04では、標準のリポジトリからGnuplotをインストールして、グラフの作成を行うことができます。
参考情報
関連記事

関連書籍(Amazon)
